Italy’s public finances are under real pressure. Fewer workers are paying in, while spending on pensions, health and social care keeps rising. The weight falls on the young people who are still working.
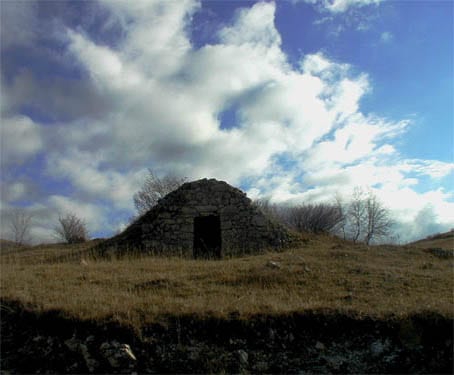
Abruzzo sits at the sharp end. Births in the region fell 10.2% in early 2025, the steepest fall of any Italian region. The population is shrinking at twice the national rate. L’Aquila and Chieti, the two oldest provinces, both have an average age above 48. In the smallest comuni, those with fewer than 1,000 residents, the average age climbs to 52. The pattern is what demographers call a “double funnel”. The mountain villages empty into the coastal towns. The coastal towns then empty into the big northern cities, especially Milan, Bologna and Rome. Where workers live and what they earn are the most important questions for any Abruzzese town’s future.
At the end of April, the income ranking for Abruzzo’s 305 towns was released. The data, from the Ministero dell’Economia e delle Finanze (MEF), is based on 2024 tax returns. Il Sole 24 Ore published it in their Mappa Redditi tool, and Corriere della Sera provided a breakdown for Abruzzo. Four mountain villages in the province of Aquila rank higher than Pescara and L’Aquila. Only Rocca di Mezzo, a village of 1,312 people in the Abruzzo, Lazio & Molise National Park, reported an average income above 27,000 euros. This matters if you’re considering moving here. It also explains why Abruzzo seems affordable to visitors and what you should check before buying.
These small towns all rank above the regional capitals. Pescara is fifth with 26,300 euros, and L’Aquila is sixth.
This might seem surprising, but it’s important. If you’re considering moving to Abruzzo, the wealth map is a valuable resource. It helps you see which towns are likely to keep their bars, grocery stores, post offices, and schools open over the next five years.
Why an Income Ranking Matters More Than a House Price
Property prices are low in much of Abruzzo’s interior. That’s widely known. But low prices alone don’t show if a town will still function in ten years. Income levels do.
Average declared income gives you a rough idea about three things that matter to buyers:
1. Whether shops have customers all year, not just in August.
2. Whether young families can afford to stay, rather than commute out.
3. Whether the council has the tax base to keep roads, schools and clinics open.
A town with an average income of 12,000 euros usually has a median age of over sixty. The school is losing students, and the grocery store may close when the owner retires. In contrast, a town with a 25,000 euro average income often still has a post office, a working cafe, a bakery, and reasons for people in their thirties to stay.
That’s why every buyer should check the wealth ranking before making a decision.
2026 Abruzzo Income Ranking
Top of the table, plus reference points further down
| Rank | Comune | Province | Avg. declared income (€) |
|---|---|---|---|
| 1 | Rocca di Mezzo | AQ | over 27,000 |
| 2 | Pescocostanzo | AQ | 26,974 |
| 3 | Scoppito | AQ | n/a |
| 4 | Rocca di Cambio | AQ | n/a |
| 5 | Pescara | PE | 26,300.32 |
| 6 | L’Aquila | AQ | 26,285.82 |
| 7 | (name TBC) | AQ | n/a |
| 8 | (name TBC) | AQ | n/a |
| 9 | Fara San Martino | CH | 25,299 |
| 10 | (name TBC) | AQ | n/a |
| 11 | Città Sant’Angelo | PE | 25,222 |
| 12 | Francavilla al Mare | CH | n/a |
| . . . | |||
| 41 | Spoltore | PE | 22,337.22 |
| 45 | Montesilvano | PE | 22,284 |
Abruzzo’s Lowest-Income Comuni 2026
| Position from the bottom | Comune | Province | Avg. declared income (€) |
|---|---|---|---|
| 305 | Corvara | PE | 12,429.74 |
| 304 | Ofena | AQ | 12,939.20 |
| 303 | Colledimezzo | CH | n/a |
| 302 | Montazzoli | CH | n/a |
Source: MEF tax declarations, 2024 incomes. Mapped by Il Sole 24 Ore. Broken down for Abruzzo by Corriere della Sera (Withub).
Eight of the top ten comuni are in the province of Aquila. The other outlier is Fara San Martino, a small town in the province of Chieti. It is home to the De Cecco, Delverde and Cocco pasta factories.
Three Patterns that Make Money in Abruzzo
There are clear reasons why these towns rank higher than the regional capitals. Three main factors set them apart.
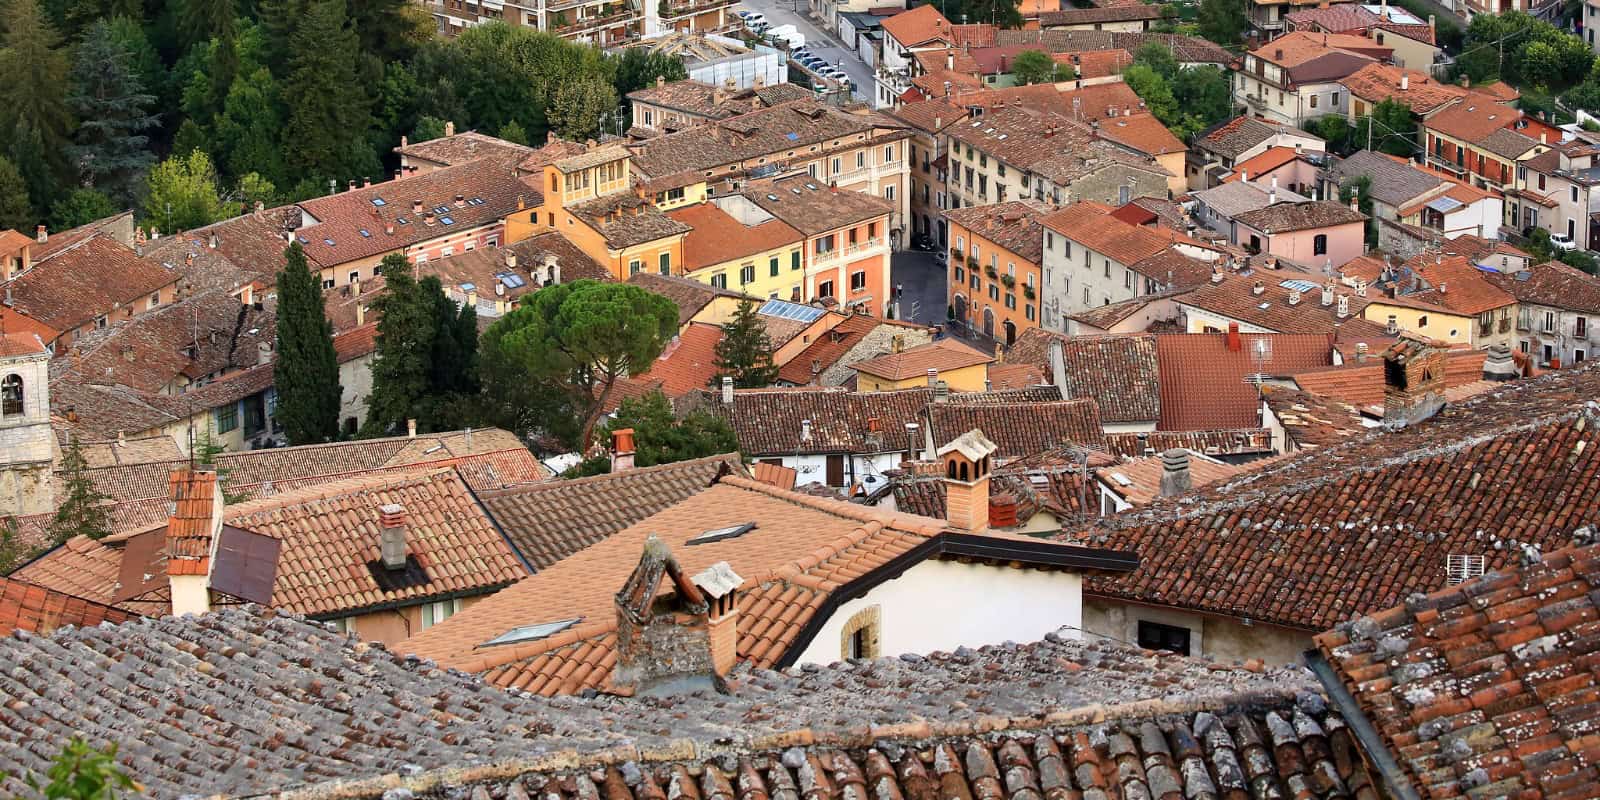
Mountain tourism and demand for second homes play a big role. Rocca di Mezzo, Pescocostanzo, and Rocca di Cambio have similar profiles. They are close to ski lifts and have good summer trails. Many second-home owners from Rome and Naples have made these towns their official residence, bringing their tax base with them. Rocca di Mezzo has 160 small businesses, about one for every eight people, mostly in tourism and services. This helps keep the town active in winter.
Stable industries also make a difference. Fara San Martino ranks ninth thanks to its pasta factories, which have been operating for over a century and export worldwide. Oricola is in fortieth place because it has the regional Coca-Cola bottling plant. Scoppito ranks third due to the pharmaceutical factories in Aquila. When industry is rooted in a town, the money stays local.
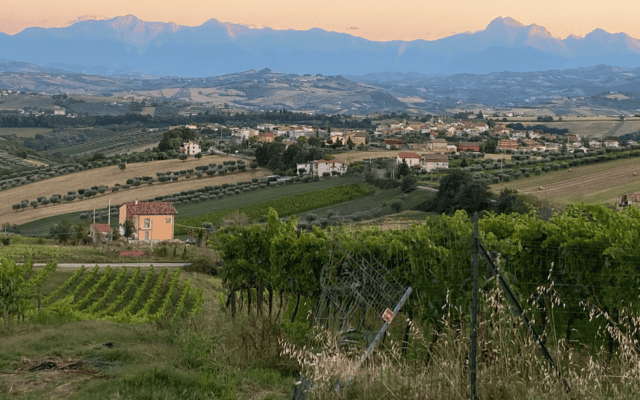
Towns near larger employers also benefit. Città Sant’Angelo and Francavilla al Mare are near Pescara’s job market. These towns may seem less exciting, but for buyers, they often offer lower house prices with city jobs just twenty minutes away.
Pure coastal tourism doesn’t make the top ten. The Adriatic coast from Roseto to Vasto has average incomes ranging from 19,000 to 22,000 euros. Tourism brings business, but not high income per person.
The Pescocostanzo Asterisk: a Useful Warning
A useful warning ran in the local press on 29 April. Pasquale Del Cimmuto, former mayor of Pescocostanzo, is a candidate in the next election. He went public to question the second-place ranking. His point: the average is pulled up by people who pay tax there but earn their money elsewhere. Most of these are second-home owners from Rome and Naples. They have moved their residence to the comune for tax reasons. The “nativi e stanziali”, the people who really live and work in the town all year, are mostly pensioners on 12,000 to 13,000 euros a year.
He’s right, and the same caution applies to Rocca di Mezzo and Rocca di Cambio. A high average income doesn’t always mean the town is lively year-round. Still, it’s a good sign for buyers. The town has a solid tax base, second homes are maintained, and local shops get business on weekends and during the season. There are more shops and services than in similar villages without this money. Visit the town in February and August before making your decision.
How Abruzzo Sits on the Italian Map
When you compare Abruzzo’s numbers to the rest of Italy, the picture shifts.
The 2024 Italian national average is 25,125 euros per person, or 25,820 euros per taxpayer (the same MEF data, two ways). Real incomes in Italy rose by 4.1% year on year. That is the first real gain in years.
Check how each region compares!
Italian Regional Income Comparison 2024
Average declared income per person, ranked from highest to lowest
| Region | Avg. declared income per person 2024 (€) |
|---|---|
| Lombardia | 29,421 |
| Trentino-Alto Adige | 27,978 |
| Emilia-Romagna | 27,434 |
| Lazio | 26,895 |
| Liguria | 26,043 |
| Toscana | 25,692 |
| Italy national average | 25,125 |
| Umbria | 24,800 |
| Marche | 24,600 |
| Abruzzo | below 24,600 |
| Calabria (lowest) | around 17,930 |
Sources: MEF dichiarazioni 2025 (anno d’imposta 2024); Excellera Intelligence Barometro; regional reporting in Il Sole 24 Ore, Corriere della Sera, Pagella Politica. Abruzzo’s exact regional figure for 2024 incomes was not separately published at the time of writing; it sits between Marche and the lower-Mezzogiorno band.
There are two main takeaways from this table.
First, Pescocostanzo’s 26,974 euros and Pescara’s 26,300 euros are not high by national standards. They sit on par with the Lazio average, well below Lombardia. The “richest” places in Abruzzo are middle-class by Italian standards. They are a long way from Milan’s 40,237 euros, or Monza’s 35,628 euros. Abruzzo’s mountain elite are nowhere near a Lombard household in good office work.
Second, Abruzzo, as a region, sits below Marche, the weakest of the Centre-North regions. It also sits well below Lazio, Toscana and Umbria. A comune doing well in Abruzzo is doing about as well as an average comune in Marche. A comune struggle in Abruzzo is much worse than the worst parts of the centre.
This is important because many buyers compare Abruzzo to Tuscany or Umbria. In terms of income, Abruzzo is much poorer. A hilltop village in southern Tuscany or rural Umbria is in a region where the economy is three to four thousand euros per person stronger than a similar village in Abruzzo.
How to Read the Income Figure: the Pension Benchmark
Here is one of the most useful filters to apply to the wealth ranking. It’s rarely written down. Italian pensions are, by international standards, fairly generous. This is especially true for people with steady careers. So a town’s average declared income tells you not just how rich the comune is, but how old it probably is.
Useful Italian pension figures to keep next to the wealth map:
Italian Pension Figures 2026
Useful benchmarks to keep next to the wealth map
| Indicator | Monthly | Yearly (gross, 13 mensilità) |
|---|---|---|
| Pensione minima INPS 2026 (with integration) | €619.80 | €8,057.40 |
| Average old-age (vecchiaia) pension | €1,021 | €13,273 |
| Average INPS pension across all categories | €1,252 | €16,276 |
| Average previdenziale (paid-in) pension | €1,444 | €18,772 |
| Average pension for men | €2,142.60 | €27,854 |
| Average pension for women | €1,594.82 | €20,733 |
Source: INPS XXIV Rapporto annuale (July 2025) and Osservatorio Statistico INPS, pensioni vigenti 1 January 2026.
A few national reference points. 28% of all Italian pensioners receive less than 1,000 euros a month. In the South, that rises to 36%. The average old-age pension (vecchiaia) is just 1,021 euros a month, or about 13,273 euros a year. This is the pension a typical Italian retires onto, without a long career of paying in.
Now, review the Abruzzo wealth map while keeping these numbers in mind.
A comune with an average declared income below 13,000 euros is below the average old-age pension. That includes Corvara, Ofena and the bottom of the table. The local economy is dominated by minimum pensions and welfare. Very little working-age income is coming in.
A comune averaging 13,000 to 18,000 euros is in pure pension territory. This is roughly where the average Italian pensioner sits. The town leans heavily toward retirees. There is a thin layer of working-age income on top.
A comune with an average of 18,000 to 22,000 euros has a mix of pensioners and working-age earners. But the working group is probably small, or earning low wages. The Abruzzese coastal strip mostly sits in this band.
A comune averaging 22,000 to 25,000 euros has a real working-age group. They earn at or near the national average for employees (24,250 euros in 2024).
A comune with an average above 25,000 euros has either many self-employed people, a large group of tax residents earning income elsewhere, or both. Self-employed individuals pull up the average because their reported incomes are high. Pescocostanzo’s 26,974 euros tells you one or both of these forces are at work.
This filter is most useful for telling apart two villages that look the same on a Sunday afternoon walk. Both might have the same medieval centre, the same restored stone houses, the same wide views. One has an average income of 14,000 euros, the other 22,000 euros. The first is a retirement museum. The second is a working town with a future.
Why Abruzzo Feels Cheap, and What That Means
Visitors from overseas, Milan, Bologna, or even Rome often say the same thing. Abruzzo is wonderfully cheap. The coffee costs €1.20. The menu turistico is €20. The flat that would cost 200,000 euros in Lucca is 70,000 euros here. The first thought is to call this “great value”.
But that view doesn’t tell the whole story, and it’s important to point that out.
Low prices aren’t just a special feature of a region. They reflect what local people can afford. For example, a bar in Trastevere charges 4 euros for an Aperol Spritz because customers can pay that price. In Pescocostanzo, the same drink costs three euros because local pensioners on 12,000 euros a year can’t pay more. A surveyor in Pescara charges less than one in Bologna because the local market can’t support higher rates. The lower prices visitors enjoy are a sign of inequality, not abundance.
This isn’t meant to discourage you from moving to Abruzzo. Instead, it’s a reminder to be aware of the local economy and your own impact on it.
If you’re moving from a wealthier country, your spending brings real money into the town. Your grocery shopping, visits to the local cafe, hiring local workers, and paying council tax all make a difference. This money is welcome and important. But as more newcomers and tax residents arrive, local prices can start to rise. The affordability that attracted you may begin to fade. Pescocostanzo’s average income of 26,974 euros shows this is already happening in some areas.
The flip side matters too. In the comuni at the bottom of the wealth map, where the average income is 14,000 or 13,000 euros, prices are low because the local economy is fragile. The cafe is cheap because it is barely staying open. That kind of cheapness can go with a single retirement.
Cheap on the Menu, Hard on the Mortgage
There is a sharper version of this same point. The regional tenants’ union UNIAT (Unione nazionale inquilini ambiente territorio), declared a housing emergency in Abruzzo at the end of April.
UNIAT’s regional president Roberta Polce named three groups being pushed out of housing in Abruzzo. Pensioners on minimum pensions cannot afford market rents. Students cannot find affordable rooms in the university towns. Low-income or precarious families fall between the private market and a public housing system that doesn’t have enough to give them.
The regional ATER (public housing agency) has 4,500 flats in L’Aquila, 4,330 in Pescara, 2,023 in Lanciano and 854 in Teramo. Comune-owned flats add to that. But supply and demand are badly out of step.
The numbers on the buying side tell the same story.
In the first half of 2025, property sales in Abruzzo grew by 4.7%. That is 71 sales per 10,000 people, well below the national rate of 9.3%. By March 2026, mortgages accounted for 59-60% of purchases in the region. The average mortgage asked for in Abruzzo is 116,646 euros. In Pescara it rises to around 122,000 euros. The average TAEG (the all-in mortgage rate) is 3.3 to 3.4%.
Do the Household Budget Sums on Those Figures
A mortgage of 116,646 euros at 3.4% over 25 years works out at roughly 577 euros a month. Italian banks are unusually careful by European standards. Most cap monthly debt at 30% of net household income. A few stretch to 35% for stronger borrowers. By contrast, UK lenders work to loan-to-income multiples that often hit 40% or more. US mortgages allow up to 43%. Italian household debt is roughly half the Eurozone average, partly because of this caution.
The result of a 30% cap: a household needs at least 1,920 euros net a month to qualify for an average Abruzzese mortgage. That is about 23,000 euros net a year. For a salaried worker, that’s roughly 30,000 euros gross.
Now compare that against the wealth map. A 30,000-euro gross figure exceeds the average declared income in every Abruzzo comune except for the four at the top. A household on the regional average cannot, on a single wage, qualify for the average mortgage. Two earners on the regional average can just about manage. A pensioner on 1,021 euros a month cannot come close.
This is the part of the cheapness story that gets missed. The houses look cheap by comparison, especially next to Tuscany or Liguria. They are not cheap for most of the families who already live in Abruzzo. Rents tell the same story. Average asking rent in Abruzzo crossed 8 euros per square metre per month at the start of 2026. Rents rose 4 to 7% in the first half of 2025. A two-bedroom flat of 70 square metres now costs around 560 euros a month before bills. That is most of a minimum pension.
So when a visitor says a town is “incredibly cheap,” they’re seeing it from their own financial perspective. For a local pensioner, that same town may have rents that just went up by seven per cent, a grocery store closing due to lack of customers, and no realistic way to save for a deposit on an apartment for young people.
This isn’t meant to make you feel guilty about buying in Abruzzo. Instead, it’s a reason to be realistic about how your purchase affects the local economy. You’re bringing outside money into a market that struggles to sustain itself. This can help the town, but over time, it also changes the community.
The Bottom of the Table: Depopulation Written in Numbers
The four lowest-ranked comuni, Corvara, Ofena, Colledimezzo and Montazzoli, all sit below 13,000 euros. That puts them below the average Italian old-age pension. The pattern is brutally clear. Median age is close to sixty. Income is mostly from minimum pensions and small-scale subsistence farming. No industry. No real tourism. Schools are closed or closing. Shops are closing with their owners.
This is how depopulation appears in the numbers. Average income is about half of what it is in the top towns and below the level needed to keep a working population. As Il Centro said last week, the geography becomes “almost a sentence.” You can buy a beautiful house in these villages for the price of a small car. But the real question is whether the cafe, grocery store, and bus service will still exist in five years. In most cases, they probably won’t.
Housebuying Tips for Abruzzo
Here’s a checklist to use when you’re considering a town:
- Look up the comune’s MEF income figure. Below 13,000 euros is below the average Italian old-age pension. That is a serious depopulation warning. 13,000 to 18,000 euros is pension-only territory. Above 22,000 euros tells you working-age income is really there. A 26,000 euro figure puts a town well above the regional average, on par with the northern Italian middle ground.
- Check the population trend. A high income figure, combined with a falling population, usually means second-home tax residents propping up the average. That isn’t bad in itself, but it changes how you read the high number.
- Look for an economic anchor. A pasta factory, a pharma site, a ski resort, a regional council office, and a big employer within a short drive. At least one of these should be visible. Anchors are what keep a town’s working-age people from leaving.
- Walk the town in the low season. February and November will tell you more than August. Empty shopfronts in November are the most honest data you’ll find.
- Check the school. A primary school with a stable roll is the single best sign of whether young families are really staying.
Abruzzo’s wealth map backs up what locals already know: this region has strong contrasts. Two towns just thirty kilometres apart can be completely different. The good news is that the data is public and easy to understand. Choose your town as carefully as you would choose a property. You have a good chance of moving somewhere that will still be thriving in ten years, and you’ll be contributing to its future in a thoughtful way.
See the full Wealth Map List on Corriere della Sera, behind Paywall
References
Sources: Ministero dell’Economia e delle Finanze, dichiarazioni dei redditi 2025 (anno d’imposta 2024); Excellera Intelligence, Barometro 2026; Il Sole 24 Ore, Mappa Redditi (April 2026); Withub elaboration for Corriere della Sera (April 2026); Il Centro, “Ricchi e poveri d’Abruzzo, a Rocca di Mezzo i redditi top”, 28 April 2026; ReteAbruzzo, “Pescocostanzo, redditi alti solo sulla carta”, 29 April 2026; Abruzzo Independent (28 April 2026); Il Resto del Carlino on Marche regional figures (April 2026); Pagella Politica and Il Post on national comparison; INPS XXIV Rapporto annuale (July 2025) and Osservatorio Statistico pensioni vigenti 1 January 2026; Navuss/UNIAT Abruzzo, “Crisi abitativa in Abruzzo, l’Uniat lancia l’allarme”, 25 April 2026.

Author: Sam Dunham
Sam is a freelance SEO content creator and IGCSE Geography and English teacher in Rome. She also runs the Life In Abruzzo Cultural Association, sharing stories and insights about this captivating region. Alongside raising a teenager, Sam hosts guests at her family’s traditional home, the Little House of the Firefly in Abruzzo, offering a warm welcome and insider tips on local culture, food, and hidden gems.